golang tool pprof简单使用
1. 概述
go tool是go语言自带的工具包
| 工具 | 说明 |
|---|---|
| addr2line | 可以调用栈的地址转化为文件和行号 |
| api | go的API |
| asm | 和汇编有关的命令 |
| buildid | 在编译时,根据文件内容生成hash |
| cgo | 可帮助我们实现在GO中调用C语言代码 |
| compile | 用于编译源码生成.o文件 |
| cover | 用于分析测试覆盖率 |
| dist | 帮助引导、构建和测试go |
| doc | 用于文章管理 |
| fix | 用于解决不同版本间代码不兼容问题 |
| link | 用于库的链接 |
| nm | 可列出如对象文件.o,可执行文件或.a库文件中的函数变量符号等信息 |
| objdump | 反汇编命令 |
| pack | 打包压缩命令 |
| pprof | 自带的性能分析工具 |
| test2json | 用于把测试文件转化可读的json格式 |
| trace | 可用于问题诊断与调式的工具 |
| vet | 用于对go程序静态分析 |
2. pprof的使用
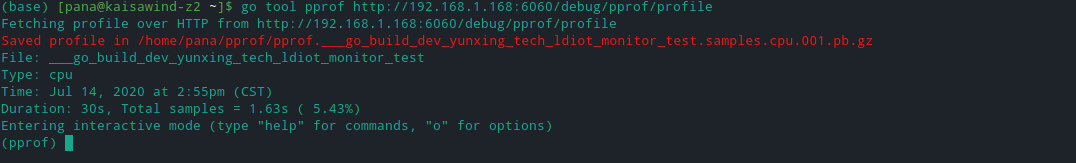
2.1 pprof交互模式
go tool pprof http://localhost:6060/debug/pprof/profile
2.2 交互模式指令
 Commands:
    callgrind        Outputs a graph in callgrind format
    comments         Output all profile comments
    disasm           Output assembly listings annotated with samples
    dot              Outputs a graph in DOT format
    eog              Visualize graph through eog
    evince           Visualize graph through evince
    gif              Outputs a graph image in GIF format
    gv               Visualize graph through gv
    kcachegrind      Visualize report in KCachegrind
    list             Output annotated source for functions matching regexp
    pdf              Outputs a graph in PDF format
    peek             Output callers/callees of functions matching regexp
    png              Outputs a graph image in PNG format
    proto            Outputs the profile in compressed protobuf format
    ps               Outputs a graph in PS format
    raw              Outputs a text representation of the raw profile
    svg              Outputs a graph in SVG format
    tags             Outputs all tags in the profile
    text             Outputs top entries in text form
    top              Outputs top entries in text form
    topproto         Outputs top entries in compressed protobuf format
    traces           Outputs all profile samples in text form
    tree             Outputs a text rendering of call graph
    web              Visualize graph through web browser
    weblist          Display annotated source in a web browser
    o/options        List options and their current values
    quit/exit/^D     Exit pprof

  Options:
    call_tree        Create a context-sensitive call tree
    compact_labels   Show minimal headers
    divide_by        Ratio to divide all samples before visualization
    drop_negative    Ignore negative differences
    edgefraction     Hide edges below <f>*total
    focus            Restricts to samples going through a node matching regexp
    hide             Skips nodes matching regexp
    ignore           Skips paths going through any nodes matching regexp
    mean             Average sample value over first value (count)
    nodecount        Max number of nodes to show
    nodefraction     Hide nodes below <f>*total
    noinlines        Ignore inlines.
    normalize        Scales profile based on the base profile.
    output           Output filename for file-based outputs
    prune_from       Drops any functions below the matched frame.
    relative_percentages Show percentages relative to focused subgraph
    sample_index     Sample value to report (0-based index or name)
    show             Only show nodes matching regexp
    show_from        Drops functions above the highest matched frame.
    source_path      Search path for source files
    tagfocus         Restricts to samples with tags in range or matched by regexp
    taghide          Skip tags matching this regexp
    tagignore        Discard samples with tags in range or matched by regexp
    tagshow          Only consider tags matching this regexp
    trim             Honor nodefraction/edgefraction/nodecount defaults
    trim_path        Path to trim from source paths before search
    unit             Measurement units to display

  Option groups (only set one per group):
    cumulative
      cum              Sort entries based on cumulative weight
      flat             Sort entries based on own weight
    granularity
      addresses        Aggregate at the address level.
      filefunctions    Aggregate at the function level.
      files            Aggregate at the file level.
      functions        Aggregate at the function level.
      lines            Aggregate at the source code line level.
  :   Clear focus/ignore/hide/tagfocus/tagignore

  type "help <cmd|option>" for more information
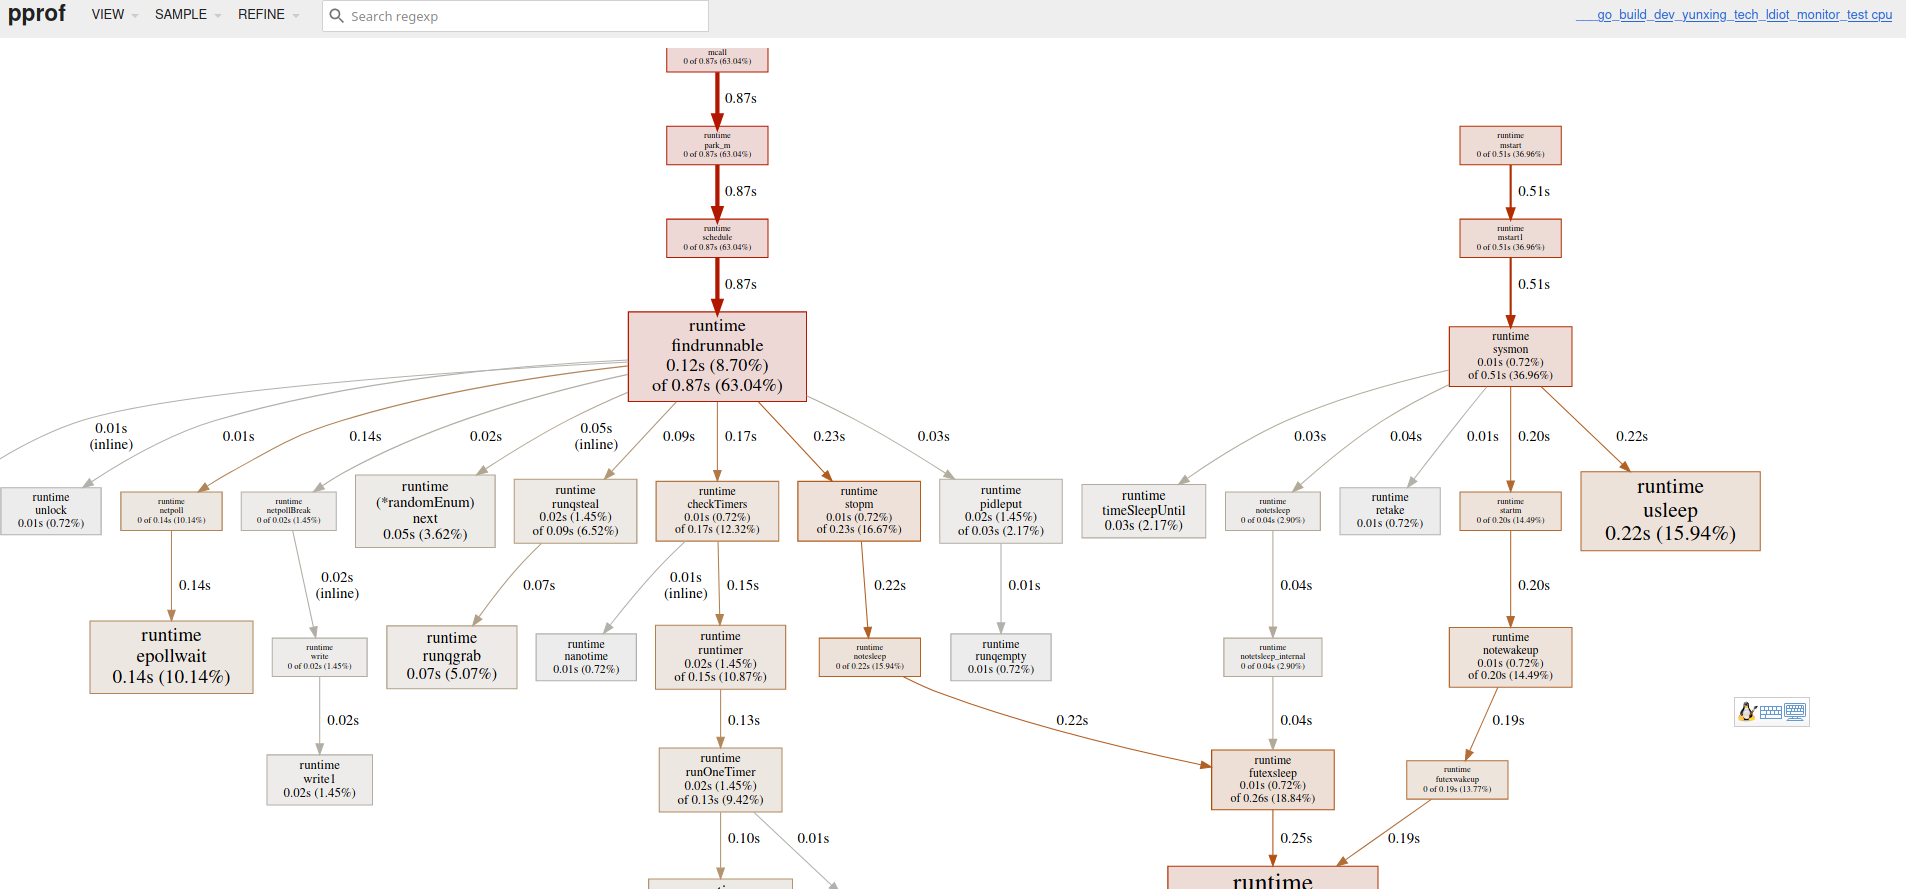
2.3 Web模式
go tool pprof -http=:6061 http://localhost:6060/debug/pprof/profile
转载请注明来源,欢迎对文章中的引用来源进行考证,欢迎指出任何有错误或不够清晰的表达。可以在下面评论区评论,也可以邮件至 wind.kaisa@gmail.com


